Two rounds of resident surveys that turned a town’s frustration with its signs into a new wayfinding system.
Working with a design team, I led two rounds of resident surveys for the Town of High Level to understand how people experience the town’s existing signage. The findings shaped a new wayfinding system built for drivers and pedestrians. It helps people find parks and local businesses and reflects the community’s culture and identity. Public satisfaction with signage rose from 25% to 61%.
Project scope
Two resident survey rounds · wayfinding sign family
Role
UX researcher · collaborating with the design team
High Level is a small, car-oriented town in northern Alberta. Its signage had grown piece by piece: inconsistent styles, poor visibility at driving speed and little sense of the town’s identity. Residents and daily visitors from Mackenzie County rely on it to find parks, downtown businesses and services.
25%Satisfied with existing signage (Round 1, before)
61%Satisfied with the new design (Round 2, after)
Research goals
What we needed to learn
01
How do people move around?
Travel modes decide sign size, height and text length.
02
Where does signage fail?
Satisfaction, confusion and the areas that need signs most.
03
What do residents value?
Sign types, visual style and cultural representation.
04
Does the new design work?
Re-measure approval with the same question after showing the concept.
Method · Round 1
Baseline survey
A 10-question survey ran on ShapeHighLevel.ca for 36 days. Question types: 5-point satisfaction scale, yes/no, ranking, multi-select and a visual preference test of five sign styles. Participation was tracked in the platform’s admin dashboard.
76Unique visitors
52Survey responses
68.4%Visit-to-contribution rate
87%Traffic from social media
Findings
Round 1: how residents rated existing signage
Only a quarter of respondents were satisfied. 73% were not satisfied, rating the signage Fair, Poor or Very poor. A “Fair” rating means the signs only half work, so we grouped it with the negative answers.
32%had been confused by signage
79%drive as their main way around
78%want local and Indigenous culture represented
84%rank “support local business” as a top goal
Insights to design
From findings to decisions
Each Round 1 finding became a specific design decision before any sign was drawn.
Finding
Design decision
79% drive; signs must read at speed
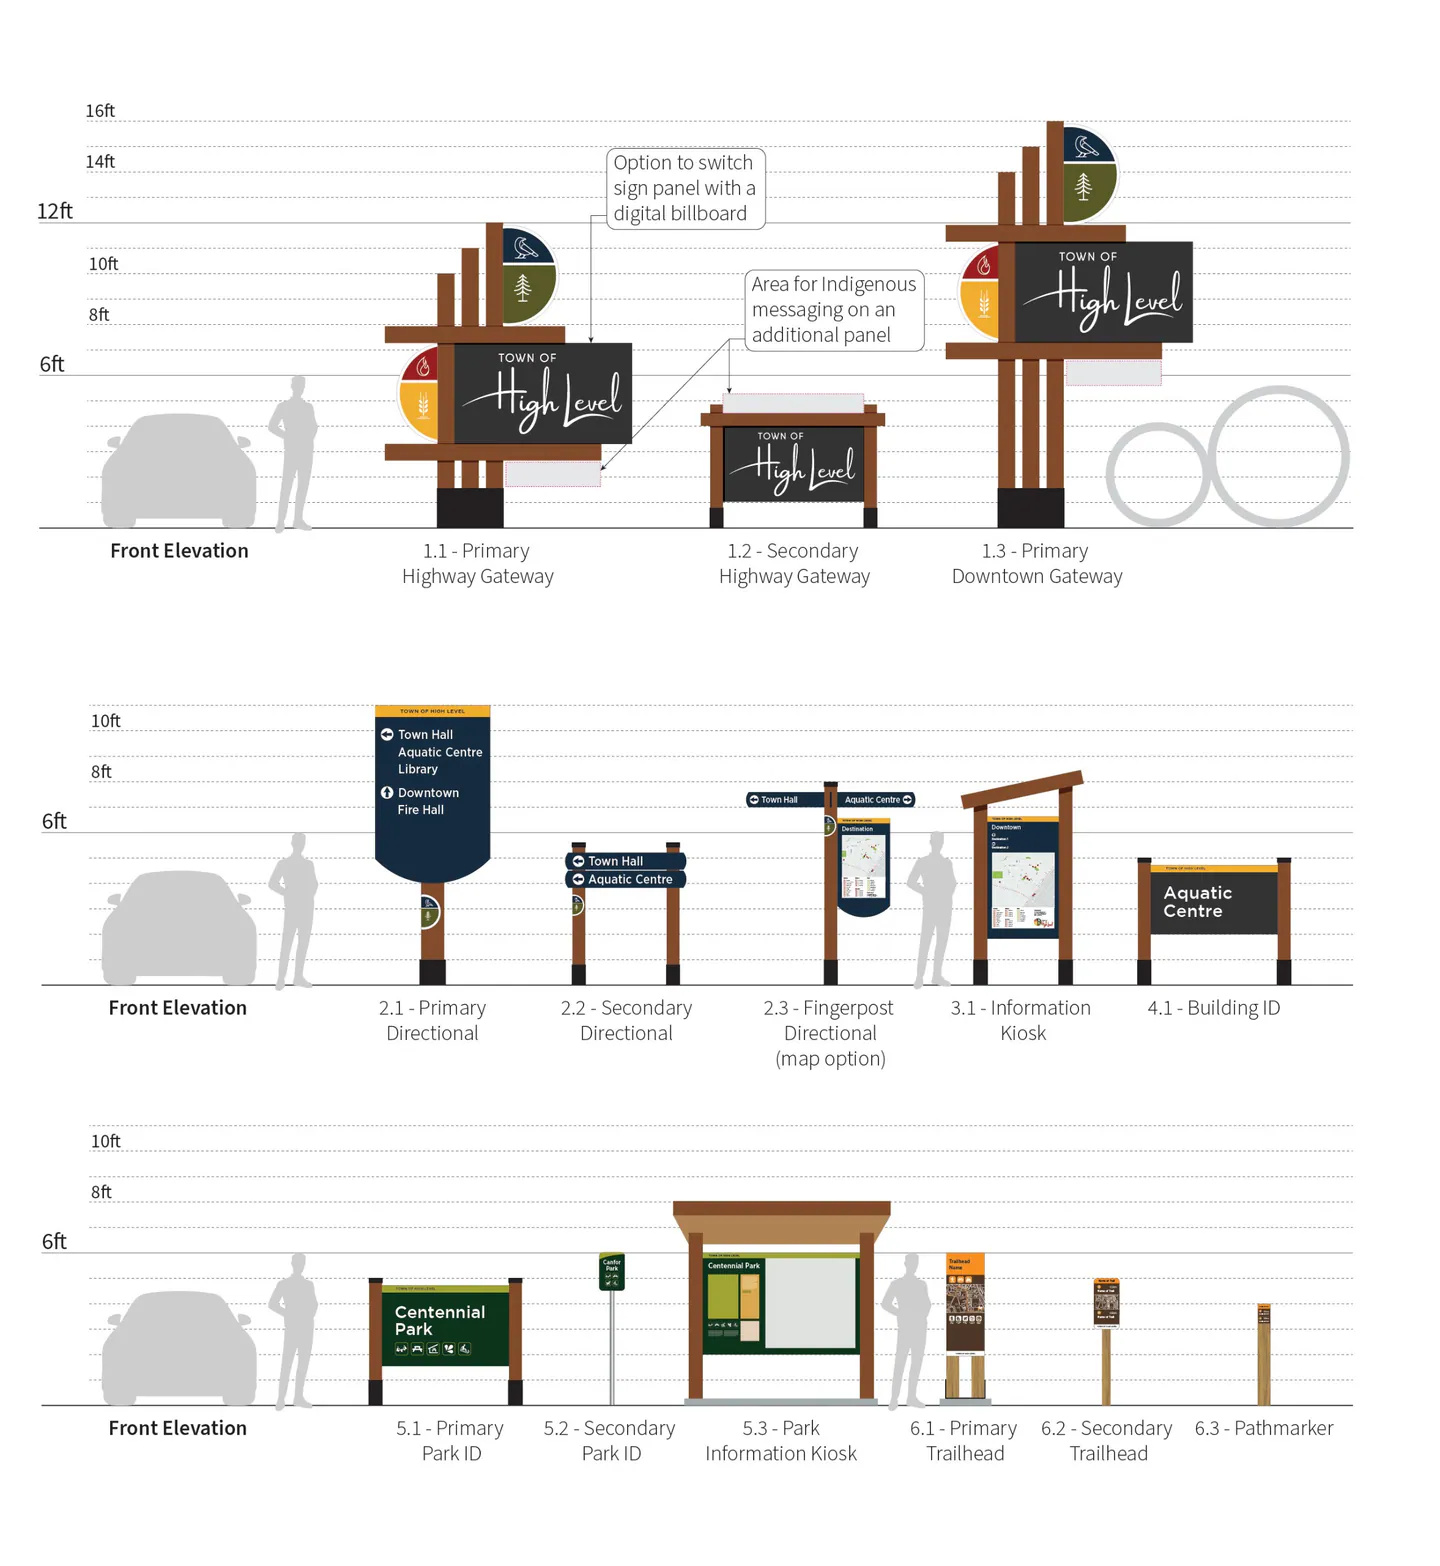
Tall gateway signs (12 to 16 ft), high-contrast panels, short destination lists
Walking and biking still matter
Pedestrian-scale fingerposts and map kiosks downtown
Parks are the #1 gap (67%)
A park and trail family: park IDs, park kiosk, trailheads, pathmarkers
Digital boards were a low priority (22%)
Left out of phase 1; gateway panels can take a digital screen later if needed
78% want cultural representation
A reserved panel for Indigenous messaging, added after consultation
Clean, modern style preferred (31%)
Consistent colour system, bold type, simple icons, timber and steel
The design
A connected sign family
Six sign types share one visual language, from highway gateways down to trail pathmarkers.
Method · Round 2
Testing the new design before installation
Round 2 was an online concept test, run before any signs were built. We made two versions of the same survey on ShapeHighLevel.ca. Version A showed images of the current signs and Version B showed the new design. The questions were identical. The Town posted the two links on alternating days, so each person saw only one version and could not learn the answers from the other. The satisfaction question matched Round 1 word for word.
1
Satisfaction rating
“How would you rate this signage?” (Excellent, Good, Fair, Poor, Very poor). The same question as Round 1, asked in Version B about the new design. The satisfied share is everyone who chose Excellent or Good.
2
Route test
A few image questions, one per page, each showing a sign at a corner on the way from the highway to the Aquatic Centre. “To get to the Aquatic Centre, which way would you go?” (Left, Right, Straight).
3
Distance test
Sign images reduced in size before uploading, so they look like signs seen from far away. “What destination does this sign show?”
4
Map task
Using the downtown kiosk map: “Where would you go for a coffee?”
5
Identity question
“These signs reflect High Level’s identity,” on a 5-point agree/disagree scale.
6
Admin dashboard
Responses, visits, conversion rate, traffic sources and time on page from ShapeHighLevel.ca, exported to CSV.
81Unique visitors
68Survey responses
84%Visit-to-contribution rate
64%Visits lasting 1+ active minute
Round 2 engagement and traffic sources
Design impact
How the design answered each goal
For each need residents raised in Round 1, we compared the two groups. The first number is from Version A (current signs) and the second is from Version B (new design). For example, in the route test both groups saw the same intersection and were asked “To get to the Aquatic Centre, which way would you go?” Only the sign in the image was different.
Route test
68% → 89% chose the right direction
Need: 32% had been confused by signage.
Design: a consistent sign hierarchy (gateway → directional → building ID), with map kiosks and fingerposts at decision points so people are guided the whole way.
Distance test
29% → 72% read the destination correctly
Need: 79% drive as their main way around.
Design: 12 to 16 ft gateways, large white type on dark panels, a maximum of five destinations per directional sign and arrows placed first. Letter sizes checked against sign-industry legibility guidelines.
Map task
21% → 64% found a downtown business
Need: 84% ranked supporting local business as a top goal.
Design: a downtown gateway, downtown listed on every directional sign, and kiosk maps that show shops, dining and services.
Identity question
14% → 58% agree the signs reflect local identity
Need: 78% want local and Indigenous culture represented.
Design: timber structure, a colour palette drawn from local land and industry, and emblem roundels. A panel is reserved for Indigenous language, to be designed through future consultation with local Indigenous communities.
Results
Before and after
Satisfaction rose from 25% to 61%, and “not satisfied” (Fair, Poor, Very poor) fell from 73% to 37%.
Round 1: existing signageRound 2: new design
Reflection
What we learned
Limitations
Small, self-selected sample (52 people), mostly reached through social media
Round 2 tested concept images on screen, which is not the same as seeing real signs from a moving car
In the distance test, people could look at each image for as long as they wanted
Respondents may have been more engaged than the general public
Next steps
Pilot 3 or 4 signs in parks and downtown
Add a timed five-second test to check reading speed
Run short intercept interviews with visitors
Consult local Indigenous communities before designing the cultural panel